
ORSANCO conducted ambient air sampling events along the upper Ohio River as part of the Ohio River Watershed Pollutant Reduction Program in 2001 and 2002. Air monitoring was conducted in order to quantify ambient air concentrations of PCBs and dioxin, identify possible hot spots of air contamination, and estimate the potential loadings to the Ohio River from atmospheric deposition. Sampling was conducted at six locations. Four rounds of air monitoring were conducted at each site from July 2001 through April 2002 (approximately every three months).
The ambient air monitoring program was expanded in 2002 to include 12 more locations in the middle and lower portions of the Ohio River.
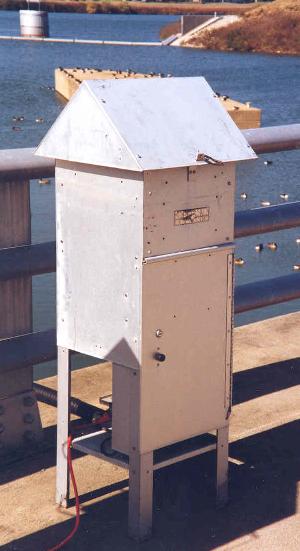
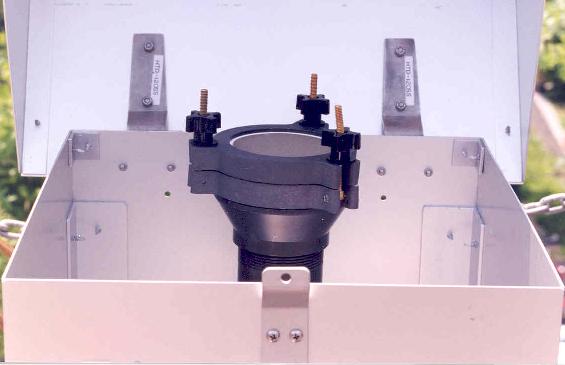
Fig. 1 TE-1000 PUF ambient air monitoring unit
Fig 2. TE-1000 PUF sampler head unit. Visible on the surface (light gray color) are particulates trapped by the glass fiber filter over a 24 hour sampling period
Method
Ambient air samples were collected following USEPA Method TO-9A. The sample collection method involved filtering 325 – 400 cubic meters of air through a quartz filter and polyurethane foam plug (PUF) assembly over a 24-hour period. Two TE-1000 PUF samplers (the equivalent of a PS-1 sampler) were used to collect the samples. Air monitoring was limited to four rounds of sampling due to budgetary constraints. Site selection was based on several factors including 1) presence of nearby facilities reporting air releases of PCBs in TRI database, 2) targeting of urban and industrialized areas with likely PCB sources, and 3) selecting sites that provided adequate spatial coverage for the large area to be assessed. Other requirements for specific site selection included the presence of a large flat area to place the samplers with no nearby obstructions to air flow (e.g., tall buildings), access to power to run the equipment, secure location to avoid tampering with the equipment, and availability of 24-hour access for periodic checks on the operation of the equipment.
| Ambient Air Monitoring Locations | |||
| Order | Location | Mile Point | Date Range |
| 1 | Avalon | 5 | 2001-2001 |
| 2 | Stowe (Pittsburgh,PA) | 8 | 2001-2002 |
| 3 | Weirton | 66 | 2001-2002 |
| 4 | Moundsville | 102 | 2001-2002 |
| 5 | Marietta | 171 | 2001-2002 |
| 6 | Williamstown | 172 | 2000-2001 |
| 7 | Letart, WV (Racine L & D) | 238 | 2001-2002 |
| 8 | Huntington | 313 | 2001-2002 |
| 9 | Portsmouth | 351 | 2002-2003 |
| 10 | Maysville | 408 | 2002-2003 |
| 11 | Cincinnati | 463 | 2002-2003 |
| 12 | Rising Sun | 508 | 2002-2003 |
| 13 | Madison | 559 | 2002-2003 |
| 14 | Louisville | 600 | 2002-2003 |
| 15 | Leavenworth | 664 | 2002-2003 |
| 16 | Cannelton | 720 | 2002-2003 |
| 17 | Evansville | 792 | 2002-2003 |
| 18 | Mt. Vernon, IN (J. T. Myers Lock and Dam) | 846 | 2002-2003 |
| 19 | Elizabethtown | 889 | 2002-2003 |
| 20 | Paducah | 937 | 2002-2003 |
Graphs of dioxin and PCB levels measured in ambient air along the Ohio River corridor are provided below.


Other Programs
- Algae & Nutrient Monitoring
- Bacteria TMDL
- Biennial Water Quality Assessment
- Bimonthly Water Quality Sampling
- Clean Metals
- Contact Recreation Bacteria
- Dissolved Oxygen Monitoring
- Emergency Response
- Fish Population
- Fish Tissue
- Harmful Algal Blooms
- Macroinvertebrates
- Mercury Supplemental Studies
- National Rivers and Streams Assessment
- Nutrient Reduction Activities
- Ohio River Users
- Organics Detection System (ODS)
- PFAS Supplemental Study
- Pollution Control Standards
- Source Water Protection
- Water Quality Trends
- Watershed Pollutant Reduction
- Wet Weather Studies