
Phenolics are a parameter of the Bimonthly Water Quality Sampling Program, which is ORSANCO’s long-term water quality monitoring program for the Ohio River. Parameters include ammonia nitrogen, biochemical oxygen demand, bromide, chloride, dissolved organic carbon, dissolved oxygen, total hardness, nitrate/nitrite nitrogen, orthophosphate, pH, specific conductivity, sulfate, temperature, total dissolved solids, total kjeldahl nitrogen, total nitrogen, total organic carbon, phenols, total phosphorus, total suspended solids, and turbidity.
Bimonthly samples are collected from 32 locations: 16 on the Ohio River main stem, and 16 on major tributaries:
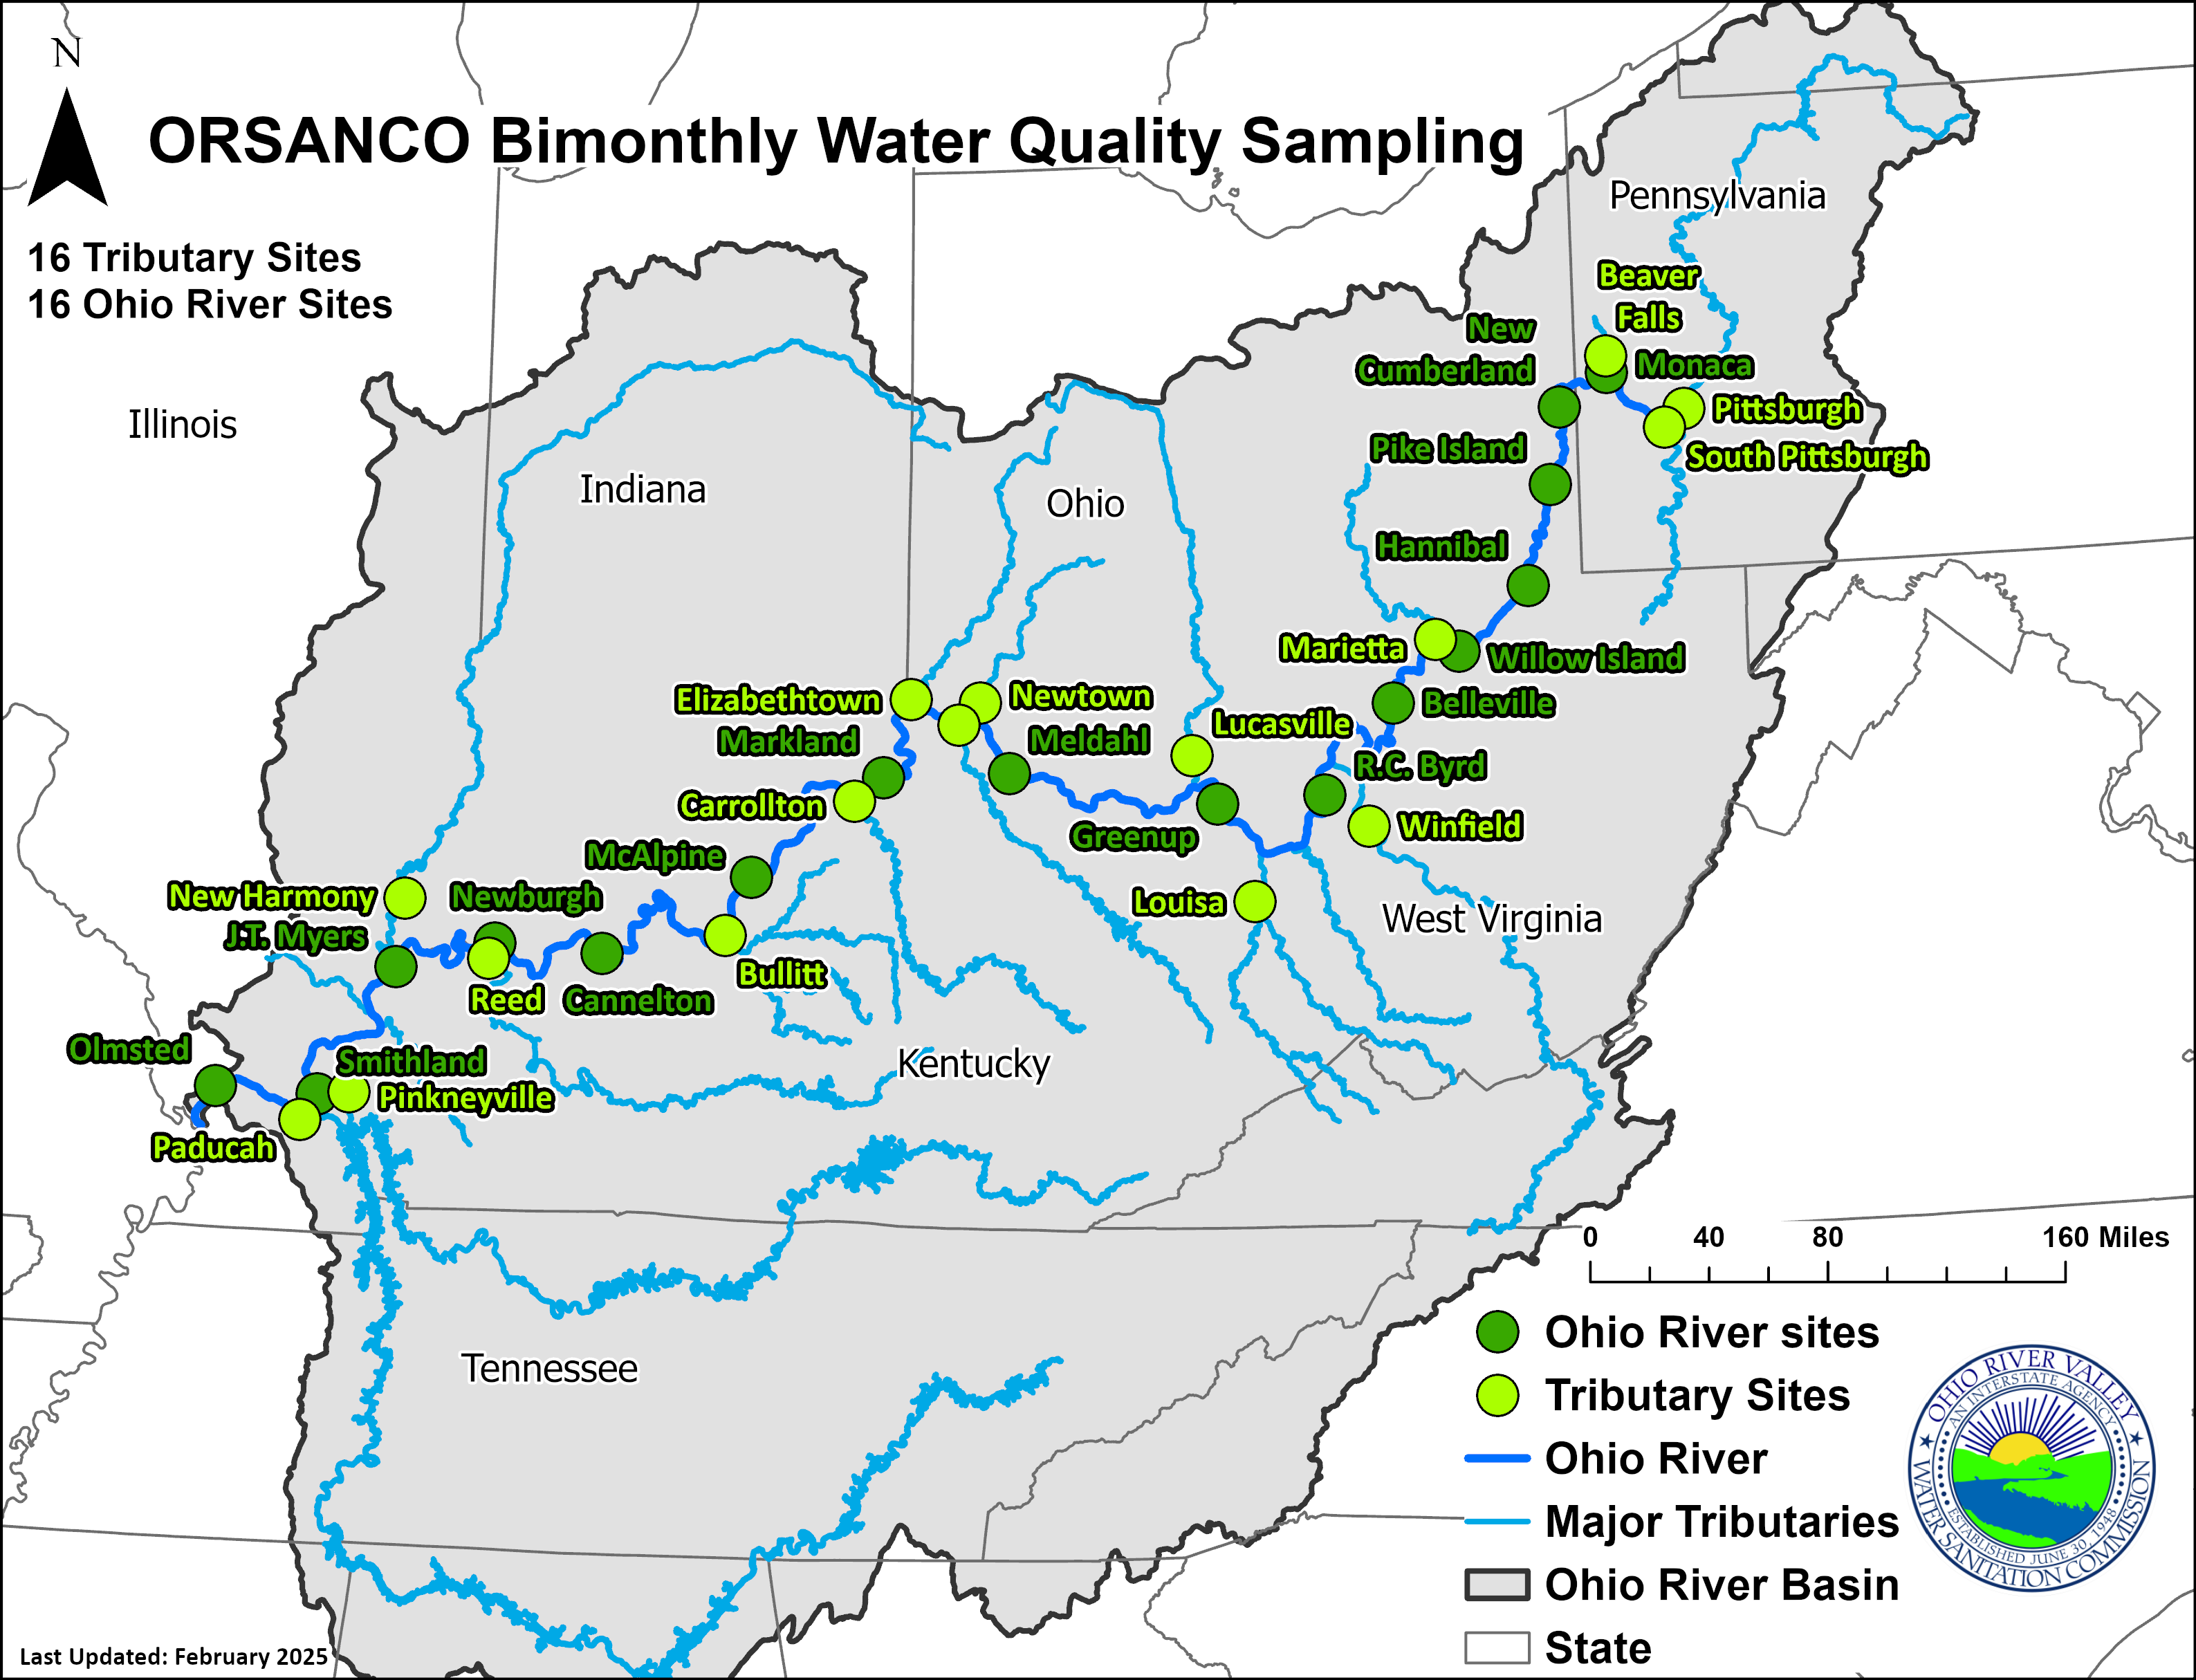
In addition to the above parameters collected bimonthly at 32 locations, trace metals are analyzed concurrently at the 16 Ohio River locations. ORSANCO adopted criteria for several inorganic toxicants to protect human health and against chronic (long-term) and acute (short-term) toxicity to aquatic life.
All samples are analyzed at a central laboratory to maintain Quality Assurance/Quality Control protocols. Cyanide analyses are only conducted at eight of the upper-river sites during the months of January, March, and November. During warmer months, cyanide quickly decomposes into ammonia and carbon dioxide and is rarely detected, and as such, is only analyzed during winter months.
ORSANCO submits bimonthly data from 1975 through the most current analyses to USEPA’s Water Quality Exchange (WQX), and the National Water Quality Monitoring Council’s Water Quality Portal. Directions on how to download the bimonthly data can be found here, or you may also contact Riley Lanfear for more information.
Phenolics Data
| All Bimonthly Monitoring Water Quality Parameters Data | Download |